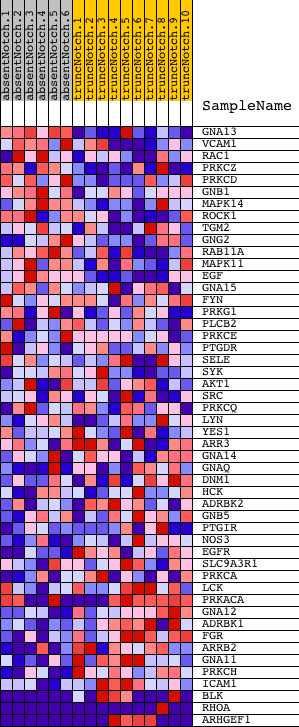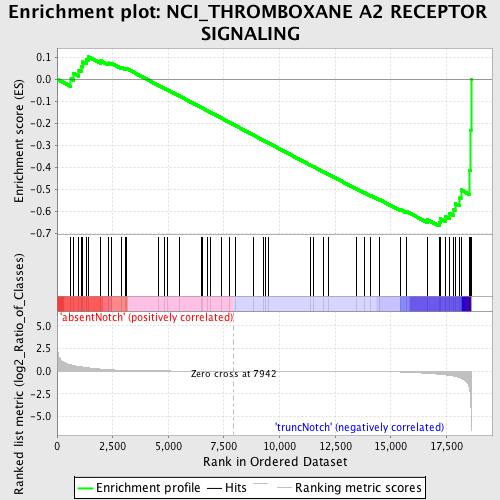
Profile of the Running ES Score & Positions of GeneSet Members on the Rank Ordered List
| Dataset | Set_03_absentNotch_versus_truncNotch.phenotype_absentNotch_versus_truncNotch.cls #absentNotch_versus_truncNotch.phenotype_absentNotch_versus_truncNotch.cls #absentNotch_versus_truncNotch_repos |
| Phenotype | phenotype_absentNotch_versus_truncNotch.cls#absentNotch_versus_truncNotch_repos |
| Upregulated in class | truncNotch |
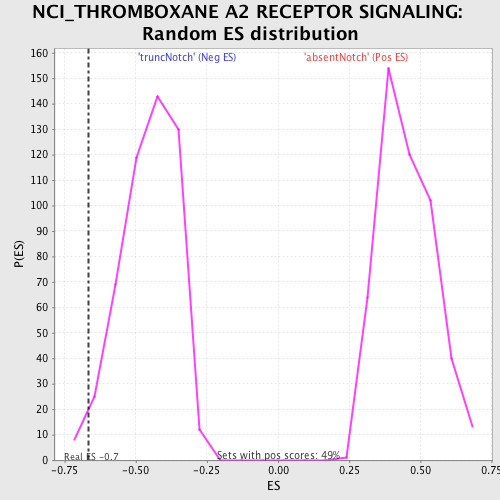
| GeneSet | NCI_THROMBOXANE A2 RECEPTOR SIGNALING |
| Enrichment Score (ES) | -0.6676539 |
| Normalized Enrichment Score (NES) | -1.4724995 |
| Nominal p-value | 0.02173913 |
| FDR q-value | 0.4339106 |
| FWER p-Value | 1.0 |
| PROBE | DESCRIPTION (from dataset) | GENE SYMBOL | GENE_TITLE | RANK IN GENE LIST | RANK METRIC SCORE | RUNNING ES | CORE ENRICHMENT | |
|---|---|---|---|---|---|---|---|---|
| 1 | GNA13 | 4590102 | 623 | 0.677 | 0.0014 | No | ||
| 2 | VCAM1 | 2900450 | 747 | 0.610 | 0.0262 | No | ||
| 3 | RAC1 | 4810687 | 980 | 0.508 | 0.0399 | No | ||
| 4 | PRKCZ | 3780279 | 1108 | 0.457 | 0.0567 | No | ||
| 5 | PRKCD | 770592 | 1137 | 0.447 | 0.0782 | No | ||
| 6 | GNB1 | 2120397 | 1309 | 0.386 | 0.0889 | No | ||
| 7 | MAPK14 | 5290731 | 1417 | 0.354 | 0.1014 | No | ||
| 8 | ROCK1 | 130044 | 1967 | 0.218 | 0.0831 | No | ||
| 9 | TGM2 | 5360452 | 2296 | 0.157 | 0.0736 | No | ||
| 10 | GNG2 | 2230390 | 2449 | 0.135 | 0.0723 | No | ||
| 11 | RAB11A | 5360079 | 2877 | 0.091 | 0.0540 | No | ||
| 12 | MAPK11 | 130452 3120440 3610465 | 3080 | 0.074 | 0.0470 | No | ||
| 13 | EGF | 5220154 | 3128 | 0.071 | 0.0481 | No | ||
| 14 | GNA15 | 870037 | 4553 | 0.017 | -0.0277 | No | ||
| 15 | FYN | 2100468 4760520 4850687 | 4821 | 0.014 | -0.0414 | No | ||
| 16 | PRKG1 | 4120671 | 4950 | 0.012 | -0.0477 | No | ||
| 17 | PLCB2 | 360132 | 5520 | 0.008 | -0.0779 | No | ||
| 18 | PRKCE | 5700053 | 6494 | 0.004 | -0.1301 | No | ||
| 19 | PTGDR | 3850161 | 6513 | 0.004 | -0.1309 | No | ||
| 20 | SELE | 7100368 | 6746 | 0.003 | -0.1432 | No | ||
| 21 | SYK | 6940133 | 6910 | 0.003 | -0.1518 | No | ||
| 22 | AKT1 | 5290746 | 7384 | 0.001 | -0.1772 | No | ||
| 23 | SRC | 580132 | 7739 | 0.001 | -0.1963 | No | ||
| 24 | PRKCQ | 2260170 3870193 | 8013 | -0.000 | -0.2110 | No | ||
| 25 | LYN | 6040600 | 8811 | -0.002 | -0.2538 | No | ||
| 26 | YES1 | 6100050 | 9268 | -0.003 | -0.2782 | No | ||
| 27 | ARR3 | 130142 3850132 | 9382 | -0.004 | -0.2841 | No | ||
| 28 | GNA14 | 3390017 | 9521 | -0.004 | -0.2913 | No | ||
| 29 | GNAQ | 430670 4210131 5900736 | 11405 | -0.011 | -0.3922 | No | ||
| 30 | DNM1 | 1660097 5340519 | 11508 | -0.011 | -0.3971 | No | ||
| 31 | HCK | 4230592 | 11976 | -0.014 | -0.4215 | No | ||
| 32 | ADRBK2 | 1660692 | 12208 | -0.015 | -0.4332 | No | ||
| 33 | GNB5 | 4480736 6550722 6770463 | 13443 | -0.029 | -0.4981 | No | ||
| 34 | PTGIR | 2100563 | 13831 | -0.036 | -0.5172 | No | ||
| 35 | NOS3 | 630152 670465 | 14100 | -0.042 | -0.5294 | No | ||
| 36 | EGFR | 4920138 6480521 | 14489 | -0.052 | -0.5477 | No | ||
| 37 | SLC9A3R1 | 6020373 | 15442 | -0.098 | -0.5938 | No | ||
| 38 | PRKCA | 6400551 | 15714 | -0.124 | -0.6020 | No | ||
| 39 | LCK | 3360142 | 16661 | -0.250 | -0.6401 | No | ||
| 40 | PRKACA | 2640731 4050048 | 17174 | -0.342 | -0.6500 | Yes | ||
| 41 | GNA12 | 1230301 | 17238 | -0.355 | -0.6351 | Yes | ||
| 42 | ADRBK1 | 1340333 | 17453 | -0.412 | -0.6254 | Yes | ||
| 43 | FGR | 3780047 | 17639 | -0.470 | -0.6111 | Yes | ||
| 44 | ARRB2 | 2060441 | 17813 | -0.543 | -0.5924 | Yes | ||
| 45 | GNA11 | 2760156 6550671 7100068 | 17888 | -0.577 | -0.5666 | Yes | ||
| 46 | PRKCH | 5720079 | 18077 | -0.705 | -0.5403 | Yes | ||
| 47 | ICAM1 | 6980138 | 18156 | -0.795 | -0.5036 | Yes | ||
| 48 | BLK | 1940128 5390053 | 18553 | -2.150 | -0.4140 | Yes | ||
| 49 | RHOA | 580142 5900131 5340450 | 18598 | -3.530 | -0.2343 | Yes | ||
| 50 | ARHGEF1 | 610347 4850603 6420672 | 18606 | -4.560 | 0.0005 | Yes |